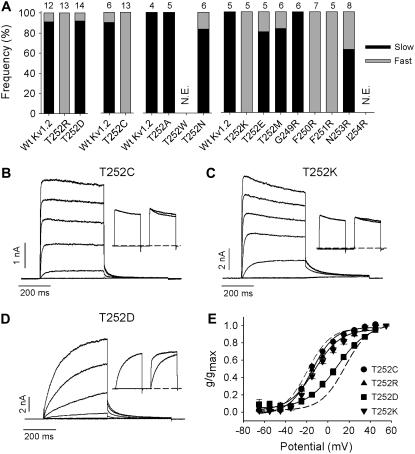
FIGURE 7.
Activation effects of charged and uncharged substitutions of T252 in Kv1.2 and of residues in close proximity. (A) The activation properties of mutant constructs indicated on the abscissa were assessed using the twin-pulse protocol. Either a −50 mV or a +40 mV step was followed by a +40 mV test potential in the second step. The interpulse potential was −100 mV. N.E. = not expressed. The frequency of “slow” and “fast” activation for each point mutation is shown as the proportion of solid and shaded, respectively, in the bar graph. The number of cells studied for each construct is shown above. Wt Kv1.2 cells studied concurrently are shown in the leftmost bar for each data set. (B–D) Experimental examples of current-voltage data from constructs in A, T252C, T252K, and T252D. Currents were elicited by depolarizing steps from −65 to +55 mV in 20-mV increments. Insets illustrate the mutant response to the twin-pulse protocol described above for A. (E) The activation V½ was −14 ± 1 mV (n = 12, k = 11.1 ± 0.6) for T252C (•), −11.2 ± 2.5 (n = 6, k = 14 ± 1.3) for T252R (▴), −10.3 ± 1.0 mV (n = 4, k = 13.7 ± 1.5) for T252K (▾) and +9.8 ± 2.3 mV (n = 4, k = 12.8 ± 0.8) for T252D (▪). The broken curves illustrate the position of the mean isochronal conductance-voltage relations for “fast” and “slow” activating channels from Fig. 1 E.

