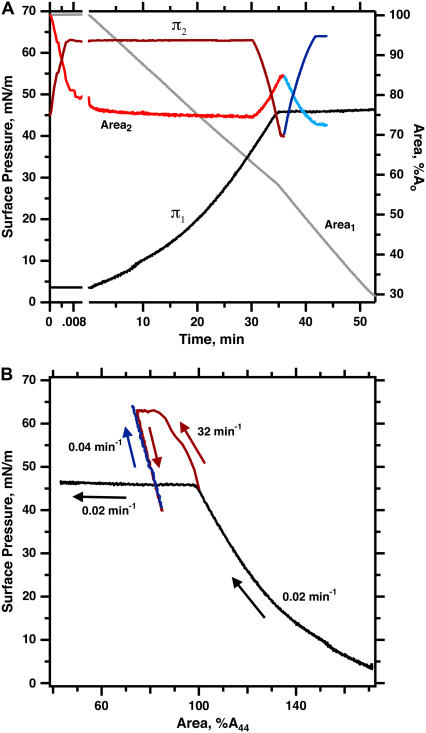
FIGURE 1.
Variation of π and area during isothermal fast and slow compressions for N&PL. Films were spread on the surface of a captive bubble, heated to 37°C, and compressed either continuously at 0.02 min−1 (experiment 1, black/gray lines), or during a brief pulse at 32 min−1, after which area was expanded and recompressed at 0.04 min−1 (experiment 2, red/blue lines). Rates of compression are expressed as A−1·dA/dt. (A) π (left axis) and area (right axis) versus time after beginning of compression. The subscripts indicate data from the same experiment. Surface area is expressed relative to the initial value (Ao) at the beginning of compression from different initial π values. (B) The same data expressed as π-area isotherms. Surface area is expressed relative to the value at 44 mN/m (A44) during the initial compression to facilitate comparison of different experiments. Arrows indicate the temporal progression of the measurements.

