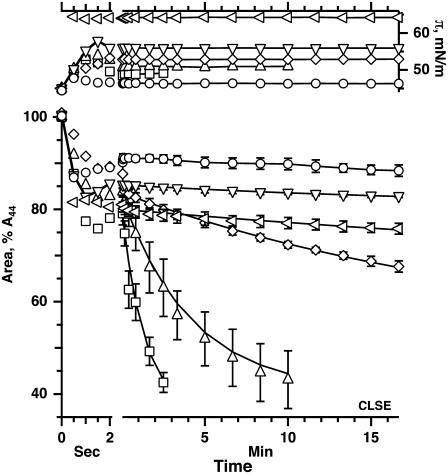
FIGURE 2.
Kinetics of isobaric collapse for spread films of CLSE. Data indicate the temporal variation of π (shaded symbols, right axis) and area (solid symbols, left axis) during an initial rapid change in area (initial portion of split time axis) followed by an isobaric compression (later time). Each symbol represents the mean of measurements at selected times for at least three experiments, ± standard deviation for area during the isobaric compression. Data at additional times and other π-values were omitted for purposes of clarity. Solid lines at times beyond 2 s give the best fit for data averaged at all times to the equation [A(t) − A∞]/[Ao − A∞] = exp (−kt), where A(t), Ao, and A∞ represent the surface area at times t, to = time at onset of constant π, and t = ∞ by extrapolation, respectively. Area is expressed relative to the value at 44 mN/m (A44) before the pulsed compression.

