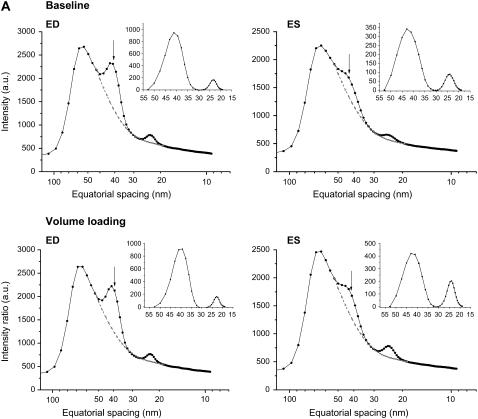
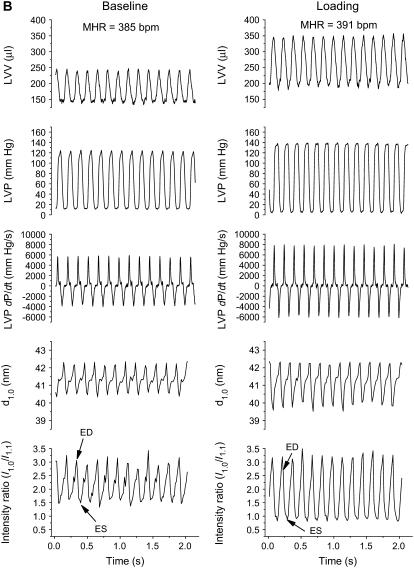
FIGURE 2.
(A and B). Examples of changes in equatorial reflection intensities recorded during 15-ms diffraction patterns in a single cardiac cycle and the calculated beat-to-beat changes in intensity ratio (I1,0/I1,1), d1,0, and hemodynamic variables over a series of heartbeats in the same heart. (A) Intensity profiles derived from cardiac diffraction patterns recorded in vivo during baseline and volume-loading conditions illustrate 1,0 (indicated by arrows) and 1,1 intensity peaks at ED and ES. Dashed lines indicate fitted background relations. Inset panels of A indicate integrated reflection intensities. Arrows show the center of the 1,0 peak (d1,0). (B) Volume loading by intravenous infusion resulted in a significant increase in LVV and SV (maximum LVV − minimum LVV), but a minor change in LVP developed and there was no change in MHR. These global LV functional changes correlated with increased systolic change in intensity ratio and a slightly greater cyclic change in d1,0.


