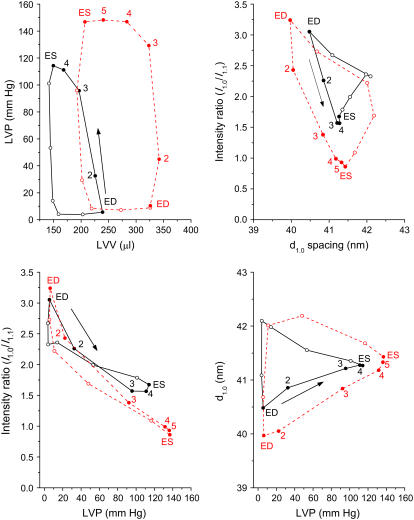
FIGURE 3.
Mean cyclic changes in LV pressure, volume-intensity ratio (I1,0/I1,1) and myosin interfilament spacing (d1,0) in the same heart during baseline (black solid lines) and volume-loading (red dashed lines) conditions. Data presented are the average loops derived from the time series of Fig. 2. Direction of the cardiac loops is indicated by an arrow in each panel for baseline loops (not different from volume loading). In each cardiac cycle, filled symbols indicate the systolic phase of contraction (ED to ES) and numerals the sequence of data points recorded from ED (point 1) to ES.

