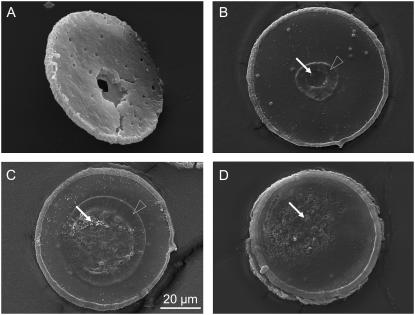
FIGURE 13.
Scanning electron micrographs of histologic specimens that were catapulted by irradiating different spot sizes with 10-μJ incident energy. The spot diameters were (A) 4 μm, (B) 30 μm, (C) 80 μm, and (D) 136 μm. These values denote the diameter of the geometric cone angle of the laser beam at the location of the specimen. The actual spot size may be smaller if the irradiance distribution has an intensity peak around the optical axis. In panel A, the specimen is viewed from the side of the histologic section, whereas in panels B–D it is viewed from the side covered with PEN foil. Solid arrows mark areas where the PEN foil is either entirely or in parts ablated; open arrowheads mark molten and resolidified regions.

