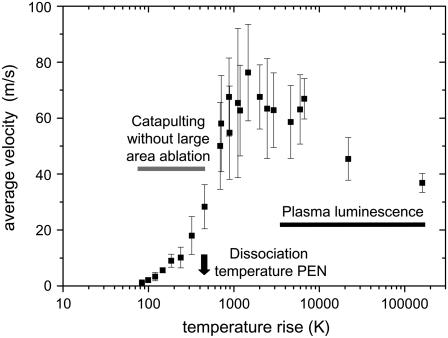
FIGURE 14.
Velocity data of Fig. 12 C plotted as a function of the temperature rise at the bottom of the specimen. The average temperature rise in the optically absorbing layer is calculated based on the laser pulse energy on the target (10 μm), the measured optical penetration depth (0.88 μm), and an average value of the heat capacity of the PEN foil (2.7 J/gK, see Fig. 3). Losses by specular reflection at the glass slide, absorption in the glass (together 5.3%), and by backscattering from the PEN foil (22.4%) were taken into account.

