
Figure 1.
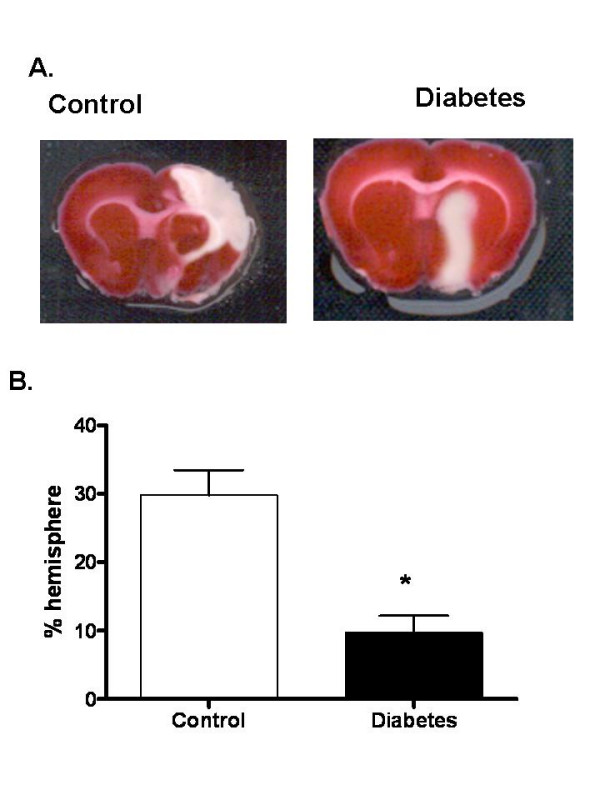
Infarct size is reduced in diabetes. (A) A representative image showing TTC staining for infarct size and localization in control Wistar (n = 10) and diabetic GK rats (n = 9). (B) Bar graph depicting infarct size in all the animals. Results are given mean ± sem and *p < 0.05 vs control.