
Figure 2.
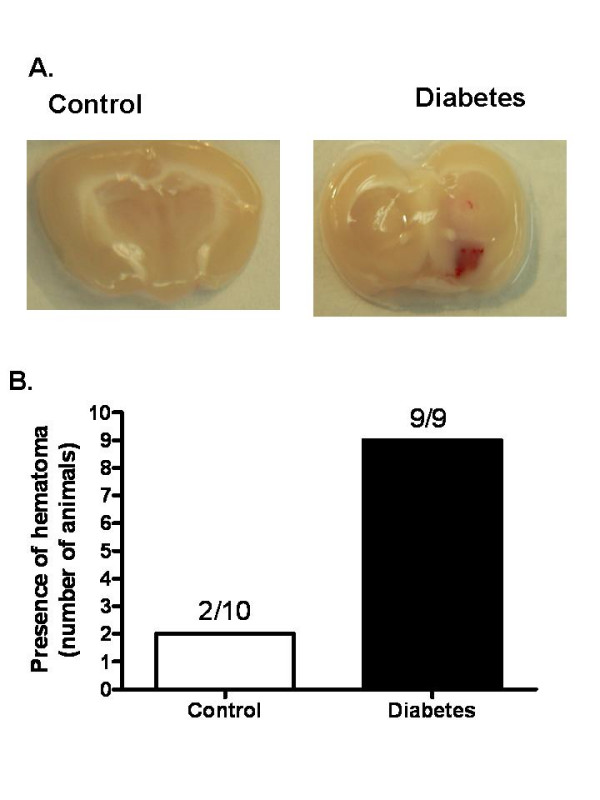
Incidence of HT is increased in diabetes. (A) A representative image showing visible hemorrhage in control Wistar (n = 10) and diabetic GK rats (n = 9). (B) Bar graph depicting incidence of HT in all the animals. Results are given mean ± sem and *p < 0.05 vs control.