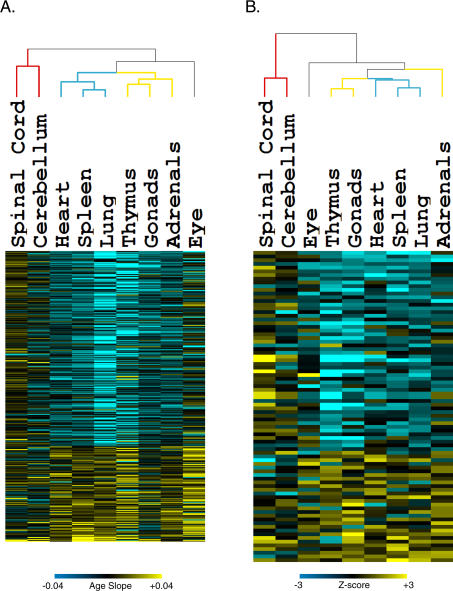
Figure 1. Genes and Gene Sets That Are Commonly Age Regulated in Multiple Tissues.
(A) Rows indicate individual genes, arranged from the gene that exhibits the greatest increase in expression with age across multiple tissues at top, to the gene that shows the greatest decrease in expression with age in multiple tissues at bottom. Each column corresponds to an individual mouse tissue. Scale corresponds to the slope of the change in log2 expression with age (β1j). Dendrogram colors indicate affiliation with either the neural (red), vascular (blue), or steroid-responsive (yellow) tissue groups.
(B) Rows indicate individual gene sets, arranged from the gene set increasing expression most on average with age in multiple tissues at top, to the most decreasing with age. Each column corresponds to an individual mouse tissue. Scale is the van der Waerden Z-value as determined by gene set enrichment analysis. Dendrogram colors indicate affiliation with either the neural (red), vascular (blue), or steroid-responsive (yellow) tissue groups. A navigable version of this figure exists at http://cmgm.stanford.edu/~kimlab/aging_mouse.

