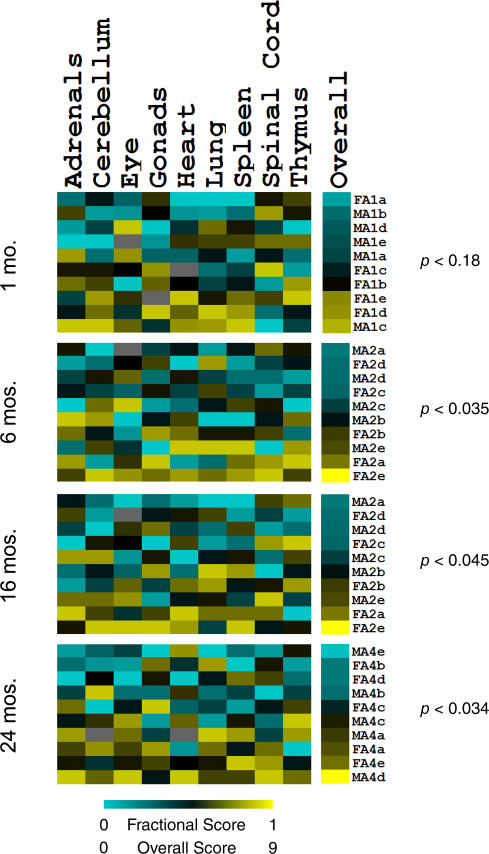
Figure 3. Coordinate Aging among Tissues in Individual Mice.
Columns refer to tissues. The rightmost column refers to the sum of fractional scores for each mouse. Rows refer to individual mice. Identification of individual mice indicates sex (M or F), age (A1 to A4), and biological repeat (a to e); e.g., FA1a is female mouse, age 1 mo, biological repeat a. Scale of tissue columns indicates the fractional score of that individual mouse with its tissue and age cohort; a low fractional score corresponds to a mouse that expresses age-regulated genes as a younger mouse, while a high fractional score expresses age-regulated genes as an older mouse. All fractional scores are summed for each mouse; the result is the overall score shown in the overall column. A low overall score corresponds to a mouse that expresses age-regulated genes as a younger mouse, while a high overall score denotes a mouse expressing age-regulated genes as an older mouse. Each p-value listed indicates the significance of tissue-coordinated aging for that age cohort.

