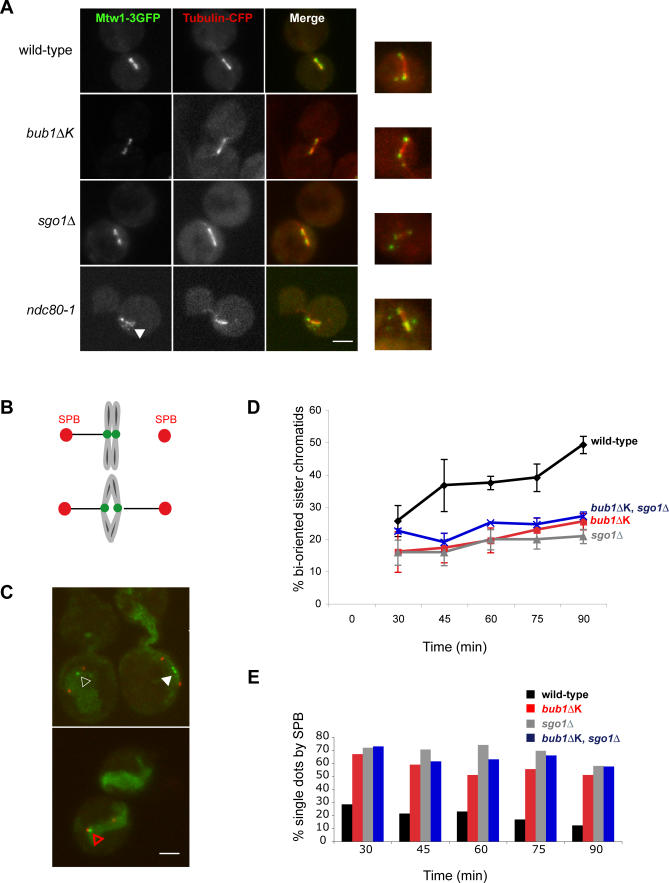
Figure 5. bub1ΔK and sgo1Δ Cells Show Defects in Establishment of Chromosome Biorientation.
(A) We analysed the indicated strains for unattached kinetochores following nocodazole treatment. Wild-type (SBY4340), bub1ΔK (JF123), sgo1Δ (JF202), and ndc80–1 (SBY4342) cells were arrested in media containing 30 μg/ml benomyl and 15 μg/ml nocodazole for 3 h at 23 °C. The microtubule drugs were then washed out three times and released into rich media at 30 °C for 20 min. The control ndc80–1 cells were grown at 36 °C for 1 h before fixation. Cells were then fixed in 3.7% formaldehyde for 5 min. We scored cells with kinetochores (Mtw1-3GFP staining) off the spindle axis as “unattached kinetochores.” All strains, apart from the ndc80–1, had mostly attached kinetochores aligned on the spindle. A total of 8% of wild-type cells contained unattached kinetochores at this timepoint (n = 212); bub1ΔK, 8% (n = 252); and sgo1Δ, 4% (n = 157) compared to ndc80–1, which had 79% (n = 96) unattached kinetochores. Right hand panel shows examples of unattached kinetochores for each strain. Scale bar represents 2 μm.
(B) Schematic of the principle of the experiment showing GFP marked centromere “breathing” upon chromosome biorientation (i.e., two green dots).
(C) Images of separated SPBs (Spc42-Tomato) containing either one GFP foci in between two SPBs (empty white triangle, scored as nonbioriented) or one GFP foci by one SPB (red empty triangle, scored as nonbioriented) or finally two GFP foci between two SPBs (filled triangle, scored as bioriented chromosome). Scale bar represents 2 μm.
(D) Wild-type (JF152), bub1ΔK (JF154), sgo1Δ (JF156), and bub1ΔK,sgo1Δ (JF202) strains carrying cenIV-GFP, Met-Cdc20, and Spc42-Tomato were synchronised in G1 for 3 h and then depleted for Cdc20 by incubating them in α-factor and 8 mM methionine for 2 h before releasing them into media containing 30 μg/ml benomyl, 15 μg/ml nocodazole, and 8 mM methionine at 23 °C for 3 h. The nocodazole was then washed out and samples were taken at indicated times. Only cells that had separated SPBs were counted for each sample (n = 100) and scored for biorientated chromatids (two GFP foci between two SPBs) versus nonbioriented chromatids (one GFP foci between two SPBs and one GFP foci by one SPB). Error bars indicate standard deviation. Standard deviations are based on five separate experiments with all strains apart from sgo1Δ,bub1ΔK double mutant strain, which was used in two separate experiments.
(E) This graph represents the cells in which the single GFP dot resided next to the SPB (red triangle) as opposed to in between the SPBs (white empty triangle), calculated as a percentage of the total cells with only one GFP dot. The data plotted are the average from two separate experiments.

