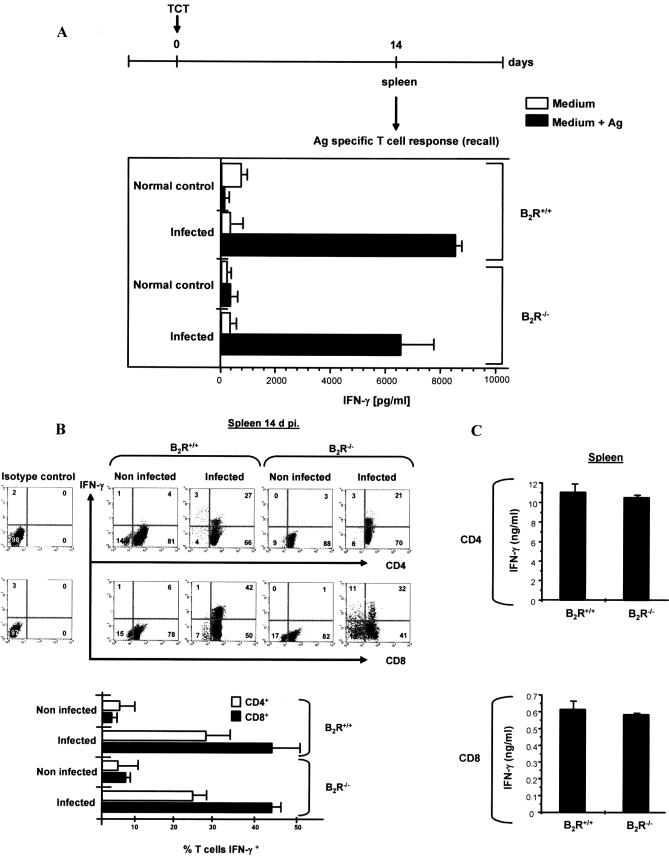
Figure 2. Splenic CD4+ and CD8+ T Cells from Infected B2R+/+ or B2R−/− Mice Produce High Levels of IFN-γ at the Early Stage (14 d p.i.) of Infection.
Infections were performed by inoculation (intraperitoneally) of 6 × 10⁵ TCT (Dm28c). Spleens were removed from infected and non-infected B2R+/+ and B2R−/− mice at 14 d p.i.
(A) Assessment of IFN-γ production by splenocytes stimulated in vitro with T. cruzi Ag (25 μg/ml).
(B) Purified CD4+ and CD8+ T cells were co-cultured with CD11c+ DCs loaded with T. cruzi Ag (25 μg/ml) for 18 h at 37 °C and were stained for CD4 or CD8 and IFN-γ as described in Materials and Methods. Dot plot profiles (n = 5 mice/group) are representative of results observed in four independent experiments. Column graphs (lower panel) indicate the mean ± SD of the frequency of IFN-γ-producing CD4+ or CD8+ T cells (n = 3).
(C) Purified CD4+ and CD8+ T cells were co-cultured with CD11c+ DCs loaded with T. cruzi Ag (25 μg/ml) for 72 h at 37 °C, and supernatants were harvested and assayed for IFN-γ levels by ELISA. Values are the mean ± SD from one representative experiment with individual cells from five mice/group. Statistics were done by ANOVA and pair-wise comparisons were done by the Tukey tests.

