
Figure 2. Frequency Distribution of Estimated CVs of SNP HET Rates in the dbSNP Database.
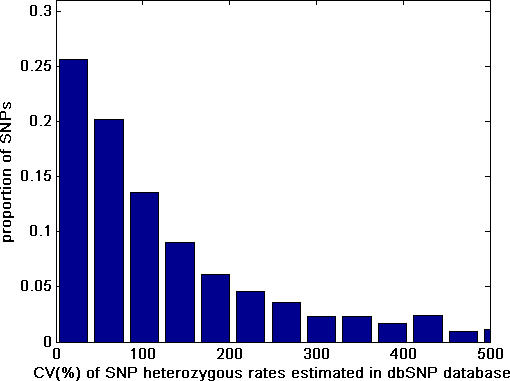
The x-axis is truncated at CV > 500% for illustrative reasons even though SNPs with higher CVs were included in the actual distribution analysis. About 30% of SNPs have an estimated CV of ≤50%, less than 13% of SNPs had an estimated CV of ≤20%, and less than 4% of the SNPs had a low CV (≤5%).