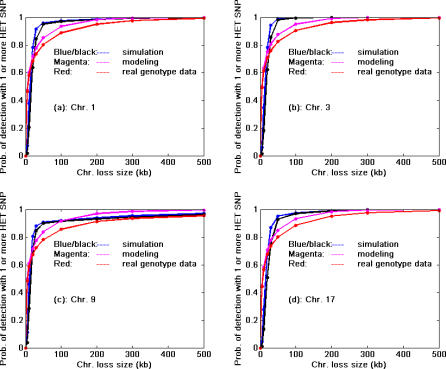
Figure 4. Relationship between Size of Chromosome Loss (kb) and Probability of Detection of LOH Assuming Use of All Chromosome 1, 3, 9, and 17 SNPs in HapMap.
Blue and black lines are the simulated results using HET rate distribution pattern in dbSNP (Figure 1) with the assumptions of successful detection if k = 15 (95%) or 20 (99%) SNPs per lost segment as shown in Equation 2. Red lines represent the probability of detection of LOH using HET SNPs based on real genotype data of 90 patients in the CEU group of the HapMap. Magenta lines represent the probability of LOH detection based on fitted model (HET SNP distribution was fitted with negative binomial distribution) prediction. The simulation results indicated a detection probability of about 75%–85% for 30 kb loss size (blue, black); the probability of detection reaches 95% or higher when loss size is approximately 50 ∼ 60 kb or larger. The LOH size approximately has to be 250 kb or larger in order to achieve a 99% or higher detection probability (except for Chromosome 9 with slightly lower probability values). The results based on real genotyping data (red line) indicate a detection probability of about 70% for a 30 kb loss size; the probability of detection reaches 95% or higher when loss size is approximately 200 kb or larger, and the loss size has to be 450 kb or larger in order to achieve a 99% detection probability. The results based on model fitting (magenta lines) appear to be a good approximation of the results based on genotyping data (red lines).

