
Figure 5. Relationship among Inter-SNP Distance, Size of LOH, and Probability of Detection of LOH with Heterozygous SNPs, Assuming an Even Distribution of SNPs.
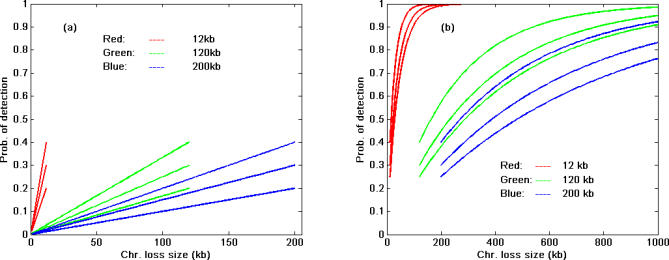
(Red lines: inter-SNP distance = 12kb; green lines: inter-SNP distance = 120kb; blue lines: inter-SNP distance = 200 kb). For each color, the three lines from bottom to top correspond to SNP HET rates of 0.2 (bottom), 0.3 (middle), and 0.4 (top).
(A) Shows the results when the chromosomal region being lost is smaller than the inter-SNP distance. For example, with a 100 kb region being lost and a 200 kb inter-SNP distance, the LOH detection probabilities are 8%, 15%, and 20% for 0.2, 0.3, and 0.4 SNP HET rates, respectively, (blue lines). The maximum detection probability is about 40% or less, depending on SNP HET rate.
(B) Shows the results when the region of loss size is larger than the inter-SNP distance. For a 300 kb region of loss size and a 120 kb inter-SNP distance, the detection probability is about 40%, 60%, and 70% for SNP HET rates of 0.2, 0.3, and 0.4, respectively, in the calculation (green lines). As the region of loss increases, approaching 900 kb, the LOH detection probability will approach 0.9 or higher when the SNPs have a HET rate of 0.3 or higher. Similarly, with a 200 kb inter-SNP distance and a region of loss of 300 kb, the probabilities of detection of LOH are about 28%, 40%, and 52% for SNP HET rates of 0.2, 0.3, and 0.4, respectively (blue lines). If the inter-SNP distance is 12 kb, the detection probability of LOH is fairly high (more than 85%) when loss size is about 100 kb or longer (red lines). The results were based on the assumption that the SNPs selected and arrayed on the chips are evenly distributed on the chromosome, which gives the most optimistic detection probability for genome-wide screening. If the selected SNPs on a chip are not evenly distributed, the detection probability will be reduced. If all the current available SNPs are used (arrayed on a chip), the detection probabilities become the pattern as shown in Figure 4.