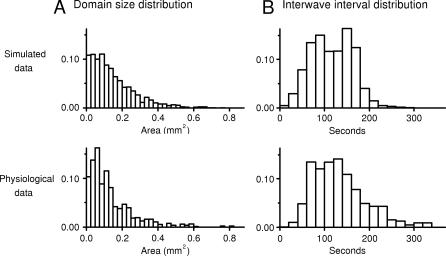
Figure 3. Comparison between Model and Ferret Wave Data.
(A) The distribution of wave sizes (also called domains [13]) of the model (top) and physiological data (bottom); bin size is 0.025 mm2; physiological data are the average of five P2–P4 ferrets, data adapted from [14]; model data are based on 3 h of simulated time. All distributions were normalized to 1.0.
(B) The IWI distribution of the model (top) and physiological data (bottom), data adapted from [14]. Bin size is 20 s. Table 1A gives the simulation parameters used to produce this output.

