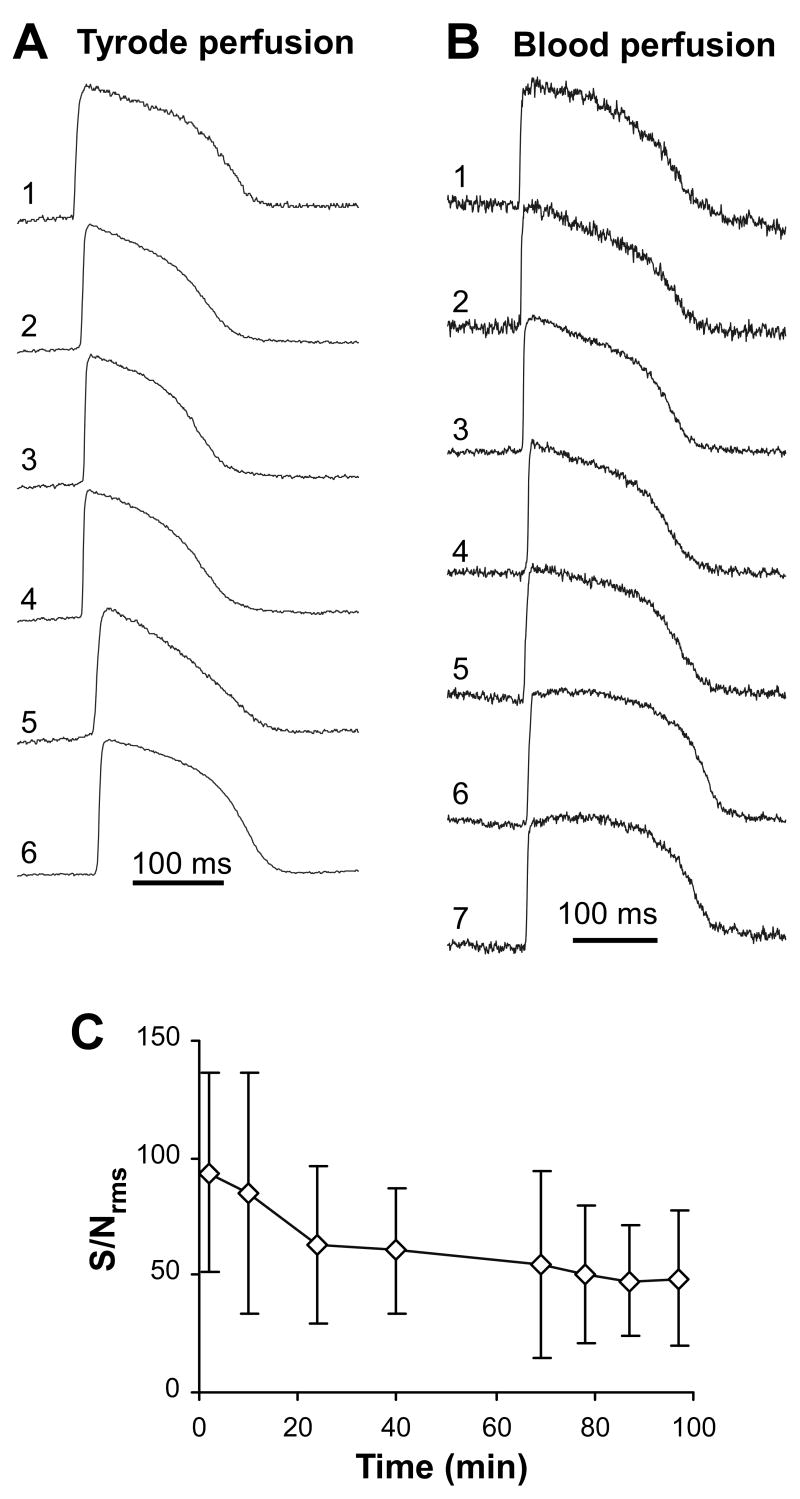
Figure 2.
Optrode recordings of intramural action potentials. Panel A, Intramural action potentials measured with a 325-μm fiber optrode in a porcine heart perfused with Tyrode solution. Numbers 1 through 6 designate recordings obtained from sub-epicardium through sub-endocardium. One fiber was outside the muscle in the cavity (not shown). Panel B, Intramural action potentials measured in a blood perfused heart. Panel C, Reduction of the average signal-to-noise ratio (SNrms) during the time of experiment in one heart.

