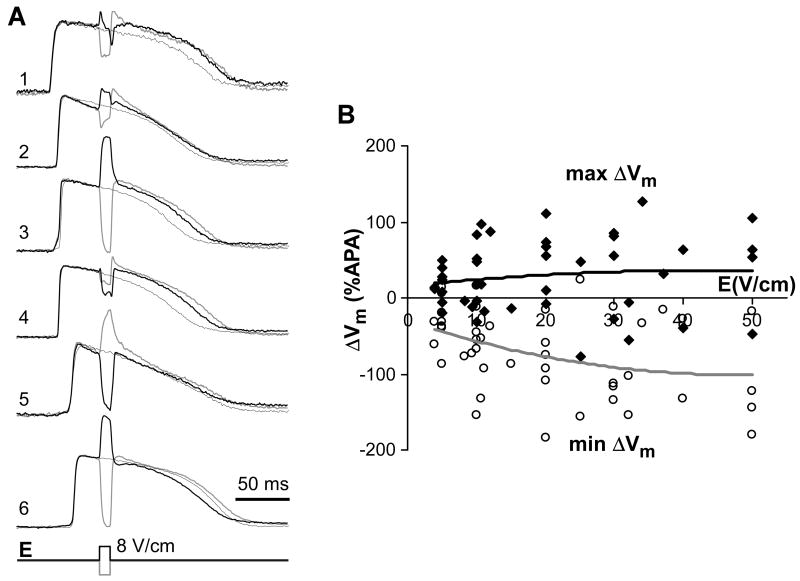
Figure 5.
Optical measurements of shock-induced ΔVm. Panel A, Intramural Vm recordings in control and during application of 8-V/cm shocks of two polarities. Recording 1 was obtained form sub-epicardium, recording 6 from sub-endocardium. Panel B, Dependences of minimal and maximal ΔVm magnitude on the shock strength. Solid lines depict second-order polynomial fits of the data.

