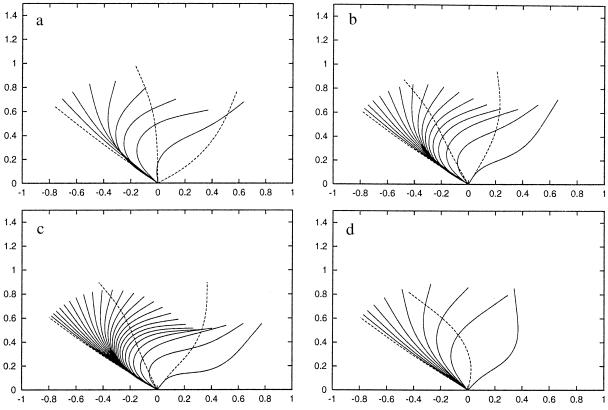
Figure 1.
Beat cycles of cilia. All positions are equally separated in time by 3 ms. The effective stroke positions are plotted by dashed lines, and the recovery stroke positions by solid lines. The units of the axes are nondimensional length. (a) A single cilium. The viscosity of the surrounding fluid is that of water, μ = μwater. The resulting beat frequency is ≈29 Hz. (b) μ = 2μwater. The resulting beat frequency is ≈17 Hz and the beat pattern is changed. (c) μ = 3μwater. The resulting beat frequency is ≈12 Hz and the beat pattern is changed. (d) Side view of an infinite line of synchronized cilia, spaced by 0.3 ciliary length, beating in water. The resulting beat frequency is ≈29 Hz.

