Figure 3.
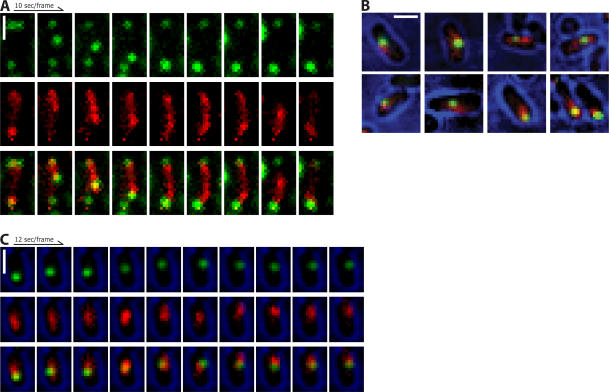
Near-simultaneous visualization of ParM and plasmids. ParM, red; plasmids, green. (A) Plasmids colocalize with the ends of spindles as they polymerize across the cell. (B) Colocalization of ParM and plasmids in cells with only one plasmid focus. (C) Time-lapse series of a cell with a single plasmid focus. Brightfield (blue) is a single image taken directly after the time series and superimposed over the fluorescence images. Bars, 1 μm. All images were contrast adjusted for clarity and rotated for ease of presentation.

