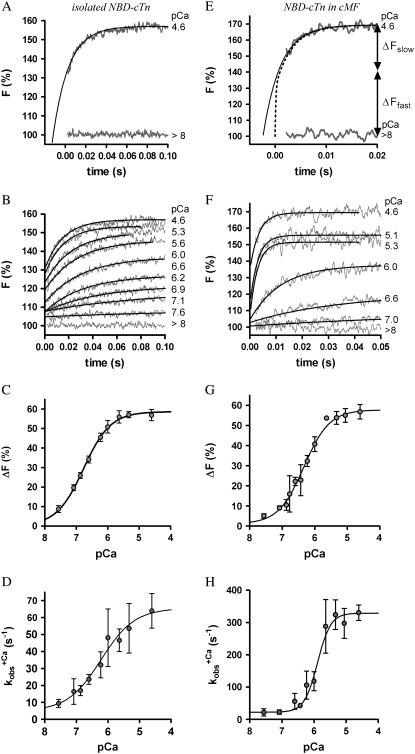
FIGURE 2.
Ca2+ dependence of fluorescence increase of isolated (A and B) and incorporated (C and D) NBD-cTn. (A) Fluorescence traces (gray lines) obtained after mixing isolated NBD-cTn (in relaxation buffer, pCa >8) at t = 0 s with activation buffer, leading to pCa 4.6. The first 2.2 ms of the traces cannot be shown because of the dead time of the stopped-flow instrument. The fluorescence trace at pCa 4.6 was fitted by a monoexponential function (solid lines) with the fit extrapolated to “negative” time. This emphasizes that within the dead time a very rapid fluorescence increase has to occur that precedes the signal, which can be fitted. (B) Same as A, but with NBD-cTn mixed with activation buffers, leading to different pCas. (C) Ca2+ dependence of the total fluorescence amplitude of isolated NBD-cTn. Symbols and error bars show means ± SE from five different preparations. The line shows a sigmoidal dose-response curve fitted to the averaged data. Corresponding fits of individual data from each of five preparations resulted in a pCa50 of 6.7 ± 0.1 and a nH of 1.0 ± 0.1 (mean ± SE). (D) Ca2+ dependence of the rate constant ( ) of the slow phase.
  data were fitted as described for ΔF in B to yield a pCa50 of 6.2 ± 0.1 and a nH = 1.4 ± 0.4 (n = 5). (E) Same as A, but with NBD-cTn incorporated into myofibrils. The dotted line shows a biexponential simulation of the fluorescence increase, as shown in Fig. 6 A. The arrows indicate the signal amplitude of the fast phase (ΔFfast) and of the slow phase (ΔFslow). (F) Same as B, but with NBD-cTn incorporated into myofibrils. (G) Same as C, but data are from six different myofibrillar preparations, resulting in a pCa50 of 6.4 ± 0.1 and a nH of 1.1 ± 0.1 (mean ± SE). (H) Same as D, but with data from six different myofibrillar preparations, resulting in a pCa50 of 5.9 ± 0.1 and a nH = 2.3 ± 0.4 (n = 6).

