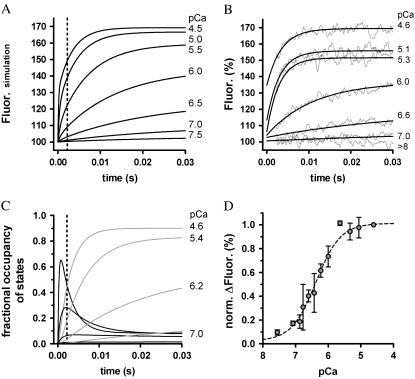
FIGURE 6.
Ca2+-induced fluorescence signals predicted by the three-state model involving Ca2+ binding and a subsequently coupled conformational change. (A) Simulated time course of fluorescence after instantaneous rises in [Ca2+] at t = 0 s to different pCa (indicated by the numbers). Kinetic parameters used for simulations were kB = 117 μM−1 s−1, kD = 550 s−1, kon = 387 s−1, and koff = 36 s−1 (for details, see text). The dotted line at 2.2 ms represents the dead time of the apparatus. (B) Same as in A, but with the fitted, experimentally determined transients to compare with the simulated curves predicted by the three-state model parameters. (C) Time courses of the transient fractional occupancies of the two Ca2+-binding states induced by different pCas. At high [Ca2+], the transient of the Tn*off·Ca2+ state (black traces) exceeds its steady state, which produces the large fast phase of the fluorescence increase depicted in A. The accumulation of the Tn*on·Ca2+ state (gray traces) is the major determinant of the observable slow phase after the dead time. (D) The experimentally determined total fluorescence increase in dependence of the activating pCa is compared with the theoretically determined total fluorescence increase predicted by the three-state model (black line).

