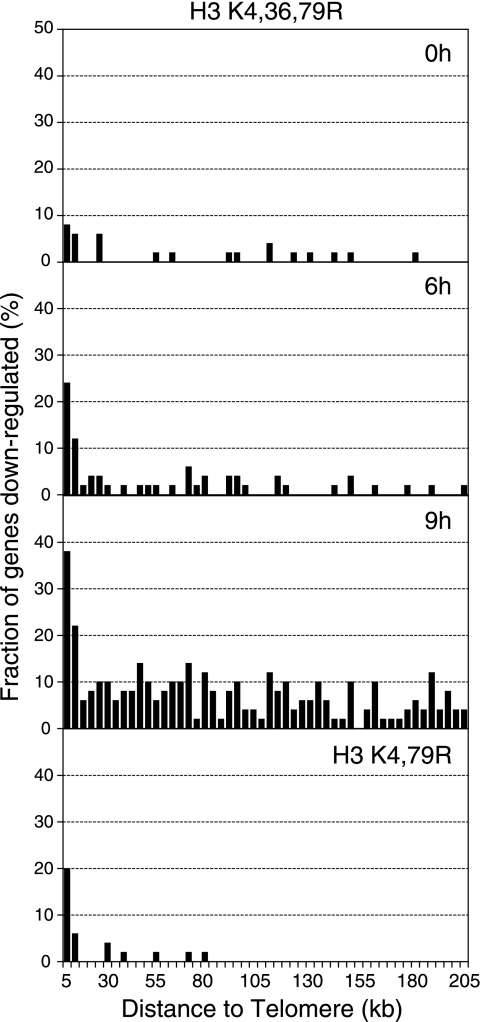
FIG. 3.
Effects of the histone H3 K4,36,79R mutant on genome-wide expression levels. Chromosome plots of the microarray data from the H3 K4,36,79R mutant at different time points following the depletion of wild-type histone H3. For each time point, a histogram of the fraction of genes whose mRNA levels are down-regulated in H3 mutants is plotted as a function of their distance from a chromosome end. The microarray data for the H3 K4,79R mutant are also shown for comparison.

