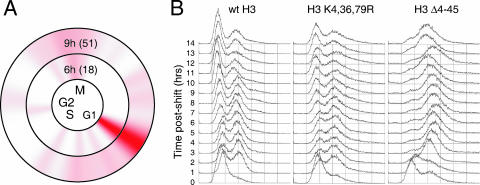
FIG. 4.
Cell cycle defects in the H3 K4,36,79R mutant strain. (A) Cell cycle display (32) of the genes down-regulated during the H3 K4,36,79R mutant time course. The circles represent the cell cycle expression patterns of 800 cell cycle-regulated genes (34). The intensity of red color indicates the number of genes that are normally expressed at that phase of the cell cycle which are down-regulated in the H3 K4,36,79R mutant strain. The total numbers of cell cycle genes that are down-regulated for each time point are listed in parentheses. (B) FACS analysis was used to measure the cell cycle profile of the H3 K4,36,79R mutant strain following depletion of wild-type (wt) histone H3.

