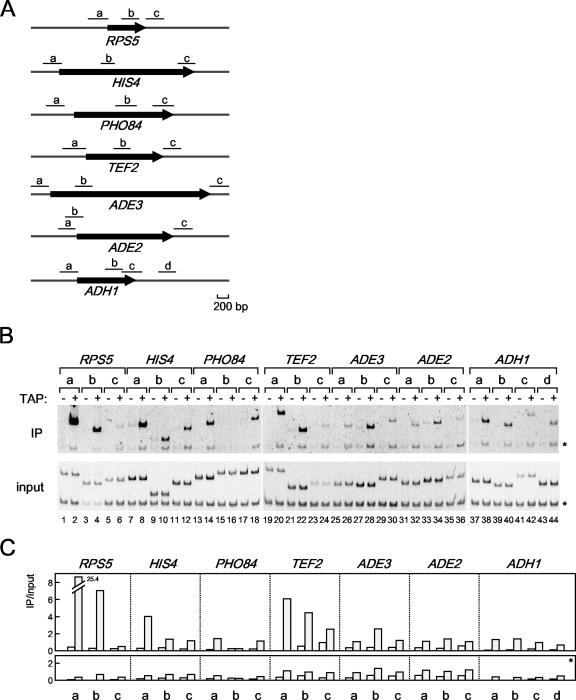
FIG. 3.
The in vivo binding of HMO1 with several class II genes. (A) Schematic diagrams of the amplified regions (a, b, c, and d) of RPS5, HIS4, PHO84, TEF2, ADE3, ADE2, and ADH1 genes by ChIP assays conducted as described in for panel B. (B) The raw data of the ChIP assays. The strains expressing the TAP-tagged HMO1 (YKK74) or the untagged HMO1 (Y13.2) were grown in YPD (yeast extract, peptone, dextrose) medium to mid-log phase at 30°C. The cross-linked chromatin from the former (even-numbered lanes; +) or the latter (odd-numbered lanes; −) strains were prepared and precipitated using immunoglobulin G-Sepharose. After the reversal of the cross-linking, PCR was performed and analyzed as described in the legend of Fig. 1A to test for the presence of DNA corresponding to the regions that are summarized in panel A. Each PCR contained a second primer pair that amplified a region (188 bp) of chromosome V that is devoid of ORFs, thus providing an internal background control (asterisk). The lower and upper panels show the results of the PCR conducted with the chromatin before (input) or after immunoprecipitation (IP), respectively. (C) The quantification of the raw data shown in panel B. The signals corresponding to each band were quantified by an image analyzer, after staining with SYBR Green I. The ratio of the precipitated signal (IP) to the input signal derived from the lysates containing the TAP-tagged (gray bar) or untagged (open bar) HMO1 was calculated for the genes indicated (upper panel) and a control region of chromosome V (lower panel, asterisk).

