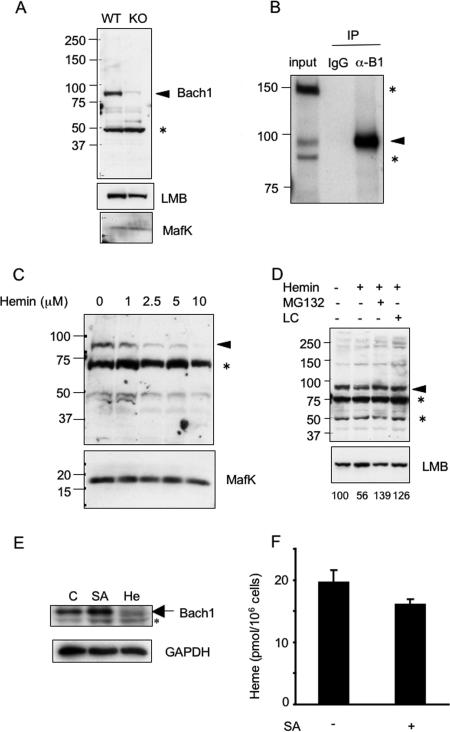
FIG. 1.
Degradation of Bach1 in response to hemin treatment. (A) Total cell extracts from wild-type (WT) and Bach1-deficient (knockout [KO]) MEFs were immunoblotted with anti-Bach1, anti-lamin B (anti-LMB), and anti-MafK antibodies. The arrowhead points to the position of the Bach1 band. The asterisk indicates an unknown cross-reactive band. The positions of molecular mass markers (in kilodaltons) are indicated to the left of the gel. (B) Total cell extracts from MEL cells were immunoprecipitated (IP) with control or anti-Bach1 antibodies, and the resulting precipitates were immunoblotted with anti-Bach1 antibody (α-B1). The arrowhead points to the position of Bach1. The asterisks indicate unknown cross-reactive bands. IgG, immunoglobulin G. (C) NIH 3T3 cells were cultured in the presence of the indicated concentrations of hemin for 2 h. Bach1 and MafK (top and bottom panels, respectively) were detected with the corresponding antibodies. The asterisk indicates an unknown cross-reactive band. (D) NIH 3T3 cells were cultured in the presence (+) of the indicated combinations of hemin (2.5 μM), MG132 (10 μM), and lactacystin (LC) (10 μM) for 2 h. Bach1 (top) and lamin B (bottom) were detected with the corresponding antibodies. The asterisks indicate unknown cross-reactive bands. Relative Bach1 levels were determined after correction for LMB levels and shown below the panels. (E) MEF cells were cultured in the absence (control [C]) or presence of 1 mM SA (24 h) or 10 μM hemin (He) (3 h). Total cell extracts were analyzed with antibodies against Bach1 and glyceraldehyde-3-phosphate dehydrogenase (GAPDH). The asterisk indicates a nonspecific band cross-reacting with the Bach1 antibody. (F) Amounts of heme in MEFs treated with SA (+) for 24 h or without SA (−) are shown.

