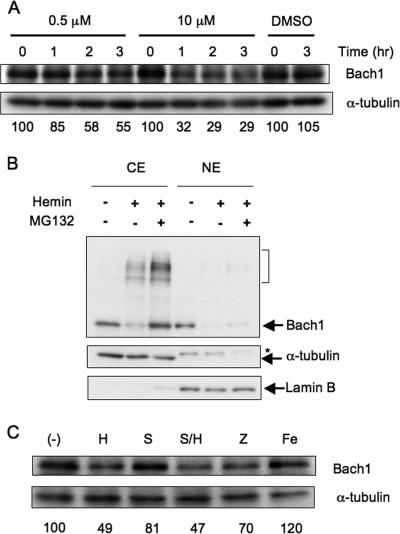
FIG. 2.
Degradation of Bach1 in MEL cells. (A) MEL cells were cultured in the presence of the indicated concentrations of hemin for 1 to 3 h. Immunoblots for Bach1 and α-tubulin are shown. Relative Bach1 levels were determined after correction for α-tubulin levels and shown below the panels. The effect of dimethyl sulfoxide (DMSO), which was used to prepare the hemin solution, was also examined. (B) MEL cells expressing FLAG-Bach1 were treated with 10 μM hemin (+) for 3 h or without hemin (−). Where indicated, 5 μM MG132 was added (+) 20 min before hemin treatment. Cytoplasmic and nuclear fractions (cytoplasmic extract [CE] and nuclear extract [NE]) were immunoblotted with antibodies against Bach1, α-tubulin, and lamin B. The bracket indicates lower-mobility bands containing Bach1. The asterisk indicates a cross-reactive band. Partitioning of α-tubulin and lamin B in the cytoplasmic and nuclear fractions, respectively, indicates successful fractionation. (C) MEL cells were cultured in the presence of 0.5 μM hemin (H), SnPP (S), ZnPP (Z), or ammonium iron(III) citrate (Fe) for 3 h. Cell extracts were analyzed with antibodies against Bach1 and α-tubulin. Relative Bach1 levels were determined by correcting for α-tubulin levels, and mean values from two experiments are shown below the panel. (−), negative control.

