
Figure 2.
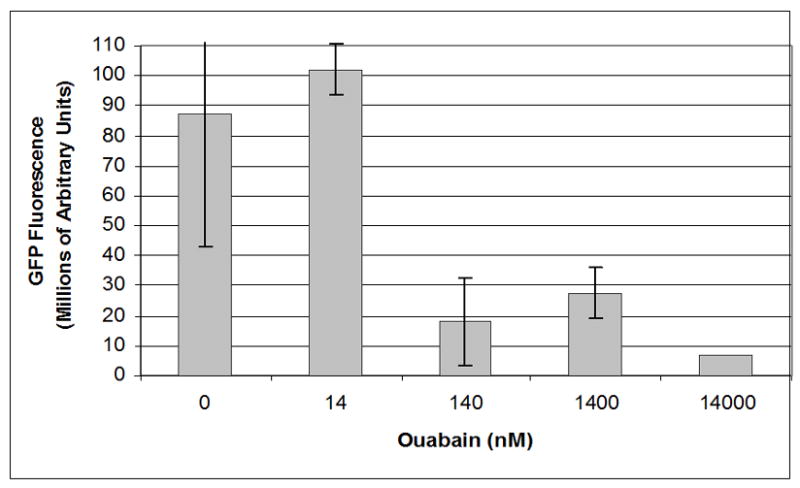
Dose response curve for effect of ouabain on GFP fluorescence. Images were analyzed with Metamorph image analysis software to quantify levels of GFP fluorescence detected after infection with ICP8-GFP virus at an MOI of 20 for 18 hours in the presence of a range of concentrations of ouabain.