
Fig. 5.
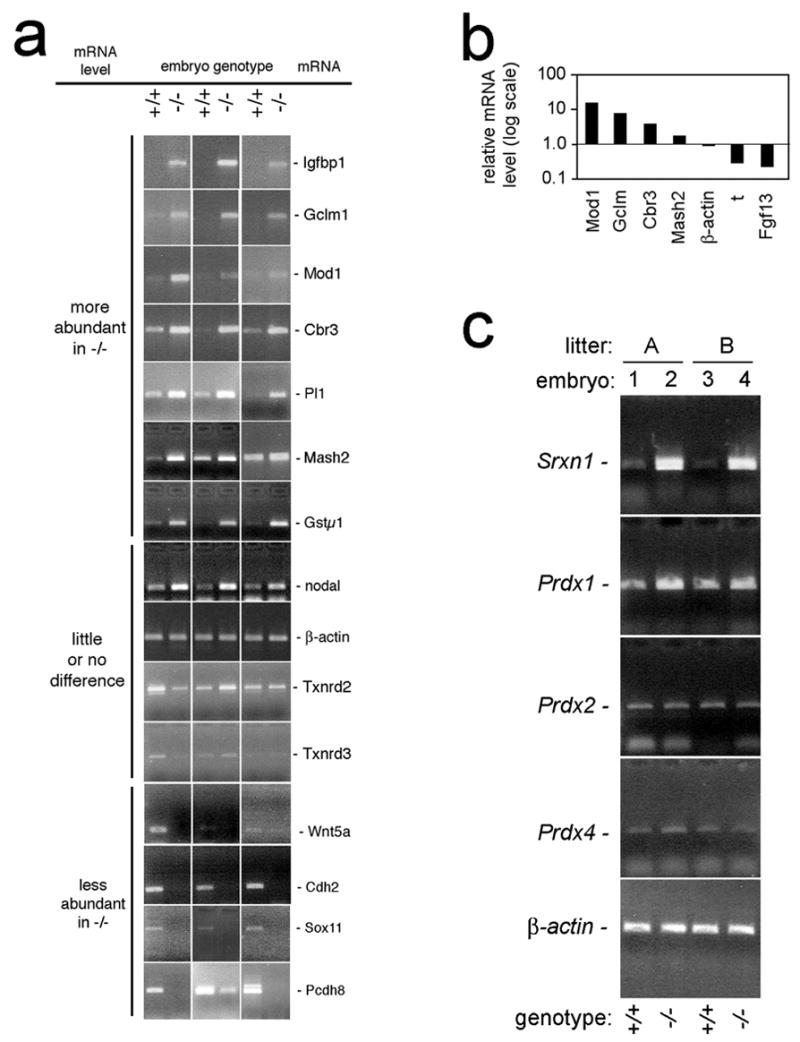
Analyses of gene expression in littermate pairs of single E7.5 txnrd1+/+ and txnrd1−/− embryos. All assays were performed on single E7.5 embryos genotyped as in Fig. 1c. a, RT-PCR confirmation of relative mRNA abundances in paired sets of txnrd1−/− and txnrd1+/+ embryos, as indicated. b, real-time PCR validation of relative mRNA levels for selected genes of interest. Each data point represents the ratio of txnrd1−/− to txnrd1+/+ mRNA in a paired littermate set of single E7.5 embryos. c, single-embryo RT-PCR confirmation of expression differences of Srxn and Prdx mRNAs from E7.5 littermate pairs of two litters, as indicated. Abbreviations: Cbr3, carbonyl reductase 3; Cdh2, cadherin homologue 2; Fgf13, fibroblast growth factor family member 13; Gstμ1, glutathione S-transferase μ1; Gclm, glutamate-cysteine ligase; Igfbp1, insulin-like growth factor-binding protein 1; Mash2, achaete-scute homologue-like 2; Mod1, malic enzyme; Pcdh8, protocadherin 8; Pl1, placental lactogen 1; Prdx, peroxiredoxin; Sox11, SRY box-containing gene 11; Srxn1, sulfiredoxin 1; t, brachyury.