
Figure 1.
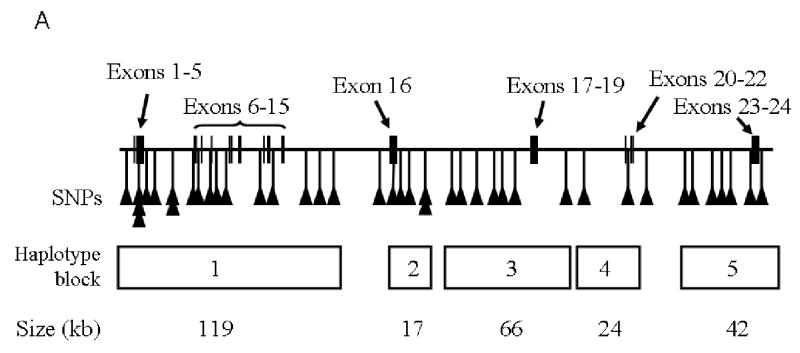
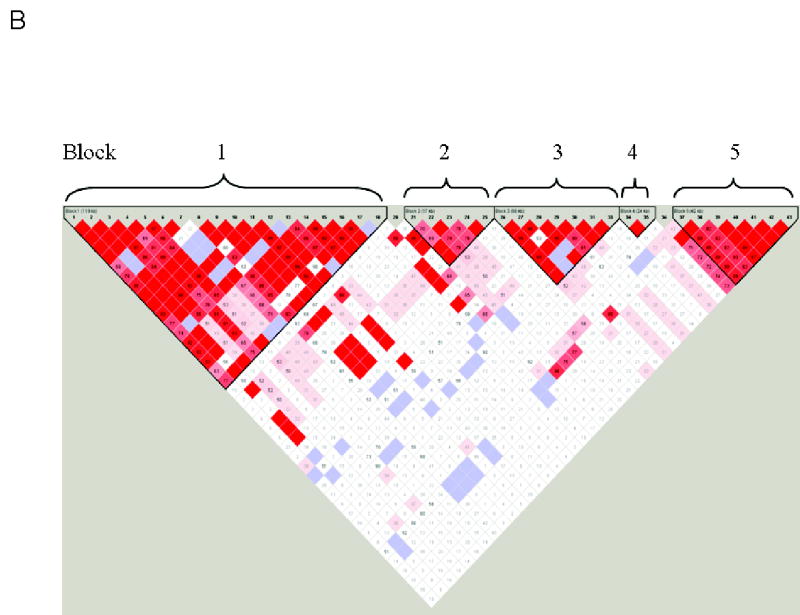
Panel A, Schematic of the NTRK2 gene showing locations of the 24 exons, SNP marker positions, and the haplotype blocks with their approximate physical sizes. Panel B, Haploview-generated LD map of the NTRK2 region in the Finnish Caucasian control sample. The AD sample produced similar results. Regions of high LD (D′ = 1 and LOD > 2) are shown in bright red. Markers with lower LD are shown in red (with D′ value indicated as a percentage) through pink (decreasing color intensity indicates decreasing D′ value). Regions with high D′ values (= 1) but low informativeness (LOD < 2) are shown in light blue. Regions of low LD and low LOD scores (D′ < 2, LOD <2) are shown in white. Five haplotype blocks are indicated.