
Figure 2.
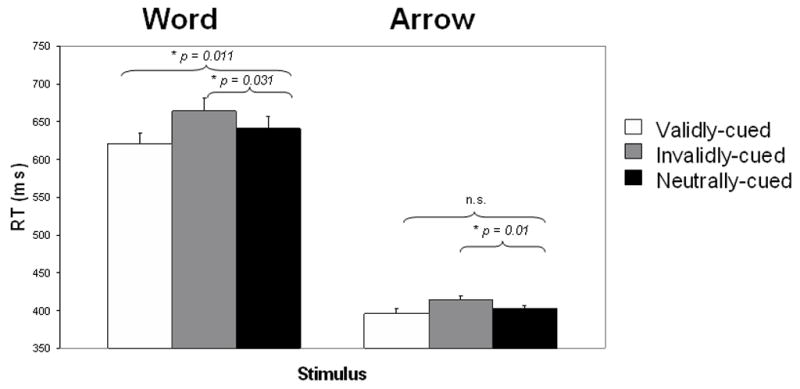
Mean reaction times for each condition in response to word (left) and arrow (right) targets. For each task, the p-values of comparisons between the neutral condition and each of the other two conditions are provided.
Official websites use .gov
A
.gov website belongs to an official
government organization in the United States.
Secure .gov websites use HTTPS
A lock (
) or https:// means you've safely
connected to the .gov website. Share sensitive
information only on official, secure websites.
Mean reaction times for each condition in response to word (left) and arrow (right) targets. For each task, the p-values of comparisons between the neutral condition and each of the other two conditions are provided.