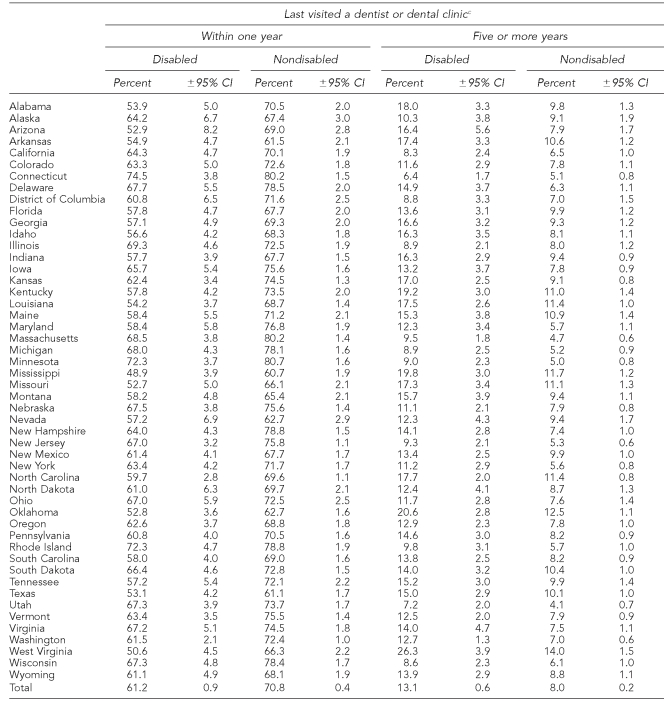
Table 1.
Prevalence of dental visits by disability status and state/area: Behavioral Risk Factor Surveillance System, 49 states, and the District of Columbia, 2004a,b
People aged 18 years or older
Hawaii completed three of 12 months of interviews in 2004; these data are not available in the aggregate 2004 dataset.
Potential responses since respondent last visited a dentist or a dental clinic for any reason included: within one year; within the past two years (one year but less than two years); within the past five years (two years but less than five years or more); five or more years; and none, don't know, or refused to respond. As before, people who did not respond, refused to respond, or whose responses were missing were excluded from the analysis. We only show estimates for the lower- and upper-bound responses given volume of information and space concerns. However, estimates for more than one year and less than five years may be gleaned by subtracting the estimates shown from 100. For example, the percentage of Alabama disabled respondents who visited a dentist more than one year ago but less than five years ago is 28.1% (100−(53.9+18.0)).
CI = confidence interval

