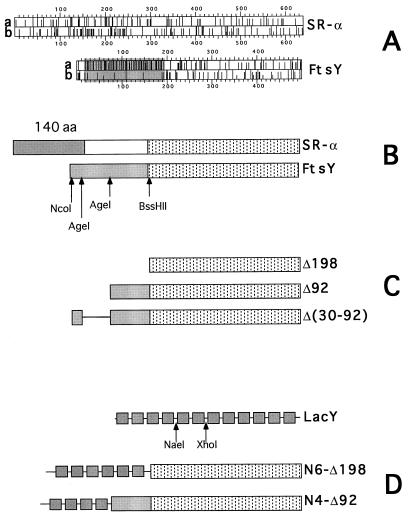
Figure 1.
Schematic representation of FtsY and SR-α, FtsY mutants, LacY, and LacY–FtsY hybrids. (A) The distribution of charged residues (line a for Glu or Asp, and line b for Arg or Lys) along the primary sequence of SR-α and FtsY. The figure was adopted from the output of the program dna strider. The shaded region highlights the acidic N-terminal domain of FtsY. (B) Schematic alignment of SR-α and FtsY. Stippled boxes represent the homologous C-terminal NG domains. The shaded (box) N-terminal 140-residue-long domain of SR-α is implicated in membrane attachment (16). The shaded box in FtsY represent the highly acidic N-terminal domain. Restriction enzymes used for mutagenesis are shown under the FtsY box. (C) Schematic presentation of the N-terminal FtsY truncated mutants (Δ198 and Δ92) and the deletion mutant Δ(30–92). The deleted regions are not shown (Δ198 and Δ92) or shown as a straight line [Δ(30–92)]. (D) Schematic picture of lactose permease (LacY) containing 12 transmembrane helices (shown as shaded boxes) and hydrophilic loops (shown as straight lines between the boxes). The enzymes used for the construction of the LacY–FtsY hybrids are shown under the LacY diagram.

