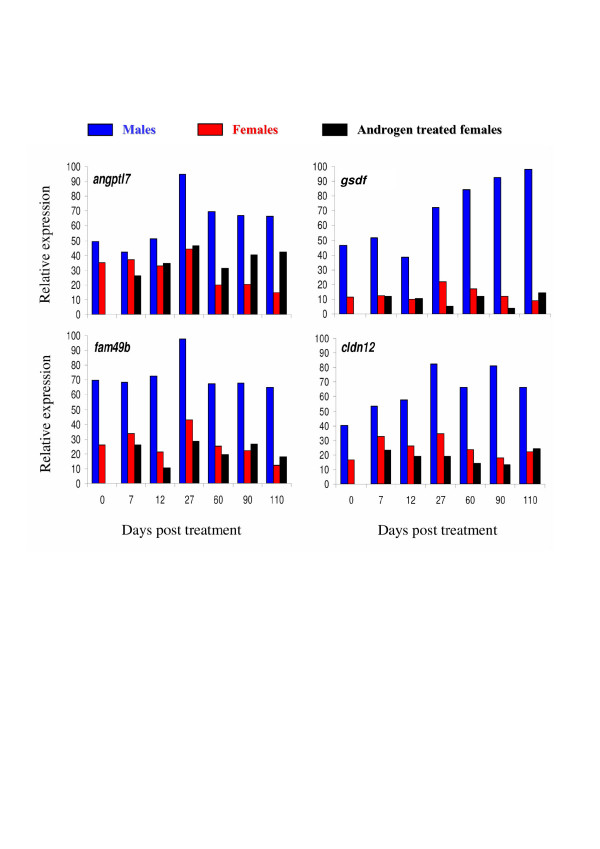
Figure 8.
Expression profiles of some representative genes from cluster 13. Expression profile values were extracted from the DNA microarray dataset and normalized to the highest signal value observed among all samples for each gene. This highest signal value was arbitrarily set at 100 and the resulting values are designated the relative signal intensity for the studied gene at the indicated time points. angiopoietin-like 7 (angptl7, tcad0004.b.24 and tcac0004.n.11), gonadal soma-derived growth factor (gsdf, tcac0002.i.22), family with sequence similarity 49, member b (fam49b, tcac0003.e.03), claudin 12 (cldn12, tcad0009.h.07).

