Figure 5.

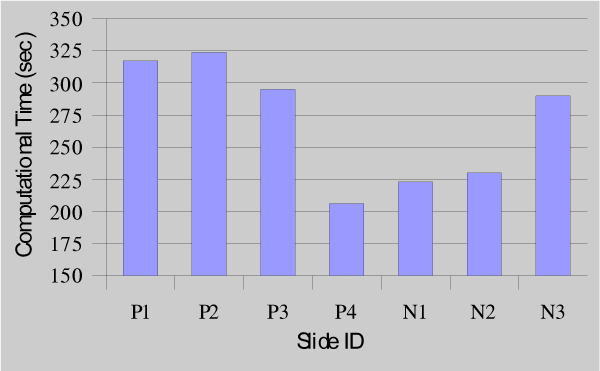
Average runtime for seven virtual slides. The average total process time for all 7 slides is depicted using the bars. The time is measured by running time in second.

Average runtime for seven virtual slides. The average total process time for all 7 slides is depicted using the bars. The time is measured by running time in second.