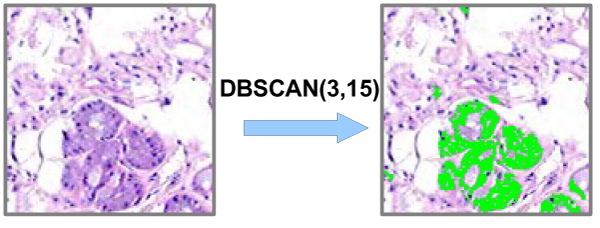
Figure 7.

Original image (left), and image (right) with colored cell nuclei by DBSCAN (ε = 3, MinPxl = 15). The density-based clustering algorithm (DBSCAN) is used to detect positive color areas, which is green area in the figure. The positive color areas are cell nuclei, which build the features for classification.
