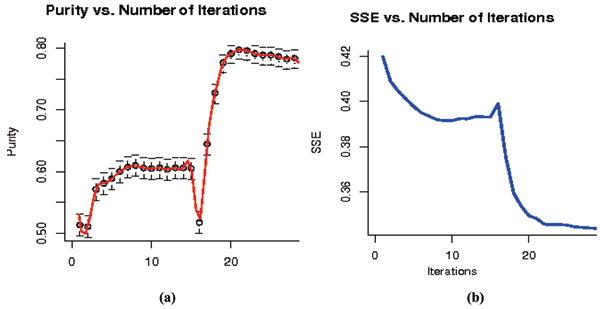
Figure 7.

(a) and (b) represent the SSE and Purity evaluation of hybrid Re-labeler with Perturbation on the same dataset. Data is initially clustered using k-means to initialize the Re-labeler algorithm. The first segment of the plot (right before the spike at 16) is the result of Re-labeler after 10% perturbation, while the second segment is the result after 30% perturbation. Purity Number of Iterations.
