
Figure 5.
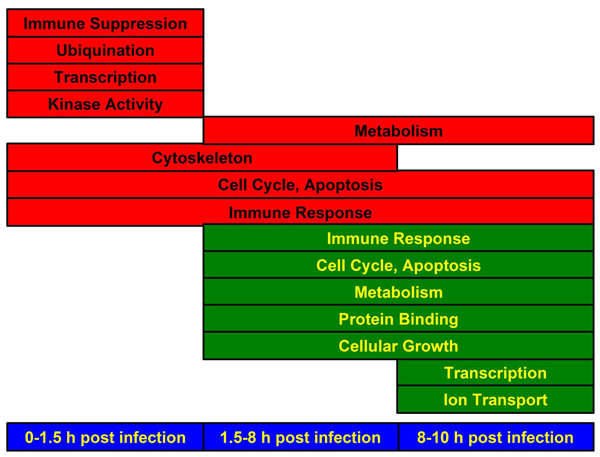
Schematic diagram of significant functions identified by IPA analysis of clusters shown in Fig. 2. Functions associated with genes that were up-regulated are shown in red and those that were down-regulated are shown in green.
Official websites use .gov
A
.gov website belongs to an official
government organization in the United States.
Secure .gov websites use HTTPS
A lock (
) or https:// means you've safely
connected to the .gov website. Share sensitive
information only on official, secure websites.
Schematic diagram of significant functions identified by IPA analysis of clusters shown in Fig. 2. Functions associated with genes that were up-regulated are shown in red and those that were down-regulated are shown in green.