
Figure 2.
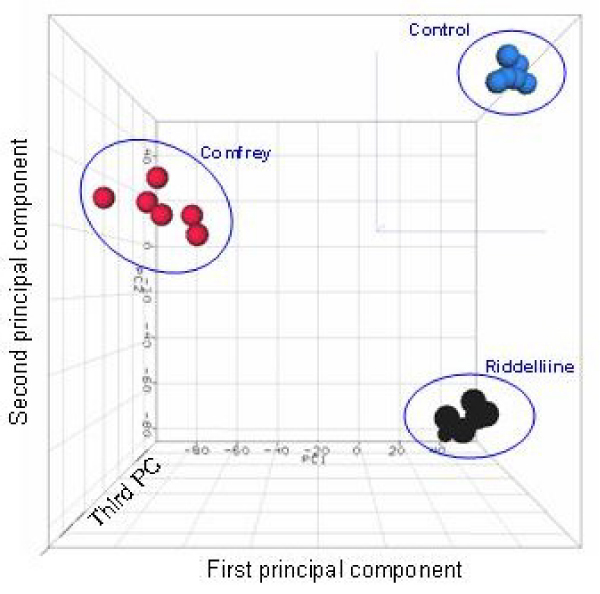
Principal Component Analysis (PCA) of expression profiles for control, 8% comfrey-fed, and 1 mg/kg riddelliine treated groups. The intensity of the entire gene set was used, and no specific cut off was applied.
Official websites use .gov
A
.gov website belongs to an official
government organization in the United States.
Secure .gov websites use HTTPS
A lock (
) or https:// means you've safely
connected to the .gov website. Share sensitive
information only on official, secure websites.
Principal Component Analysis (PCA) of expression profiles for control, 8% comfrey-fed, and 1 mg/kg riddelliine treated groups. The intensity of the entire gene set was used, and no specific cut off was applied.