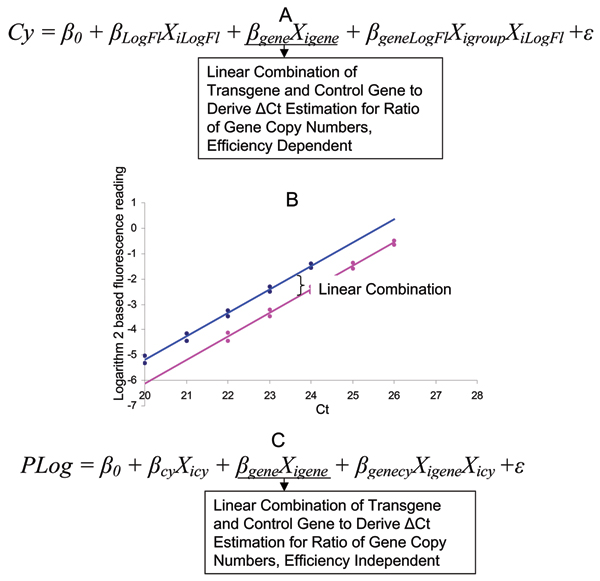
Figure 4.

Statistical models for transgene copy number determination with internal reference gene design and fluorescence data. A. Two-way ANOVA model with cycle number (Cy) as dependent variable, logarithm transformed fluorescence signal (LogFl) and gene category (transgene or reference gene) as independent variables. The model can be used to derive the ratio of copy number between transgene and reference gene and to test the equal amplification efficiency. B. The regression plot of logarithm-2-based fluorescence signal strength against cycle number for both transgene and control gene. The pink line corresponds to the transgene, and blue to the control gene. C. The multiple regression model with logarithm transformed fluorescence (LogFl) as dependent variable, and cycle number (Cy) and gene category as independent variables. The model is efficiency integrated and can be used to derive the ratio of copy number between transgene and reference gene based on linear combination of intercept.
