Fig. 4.

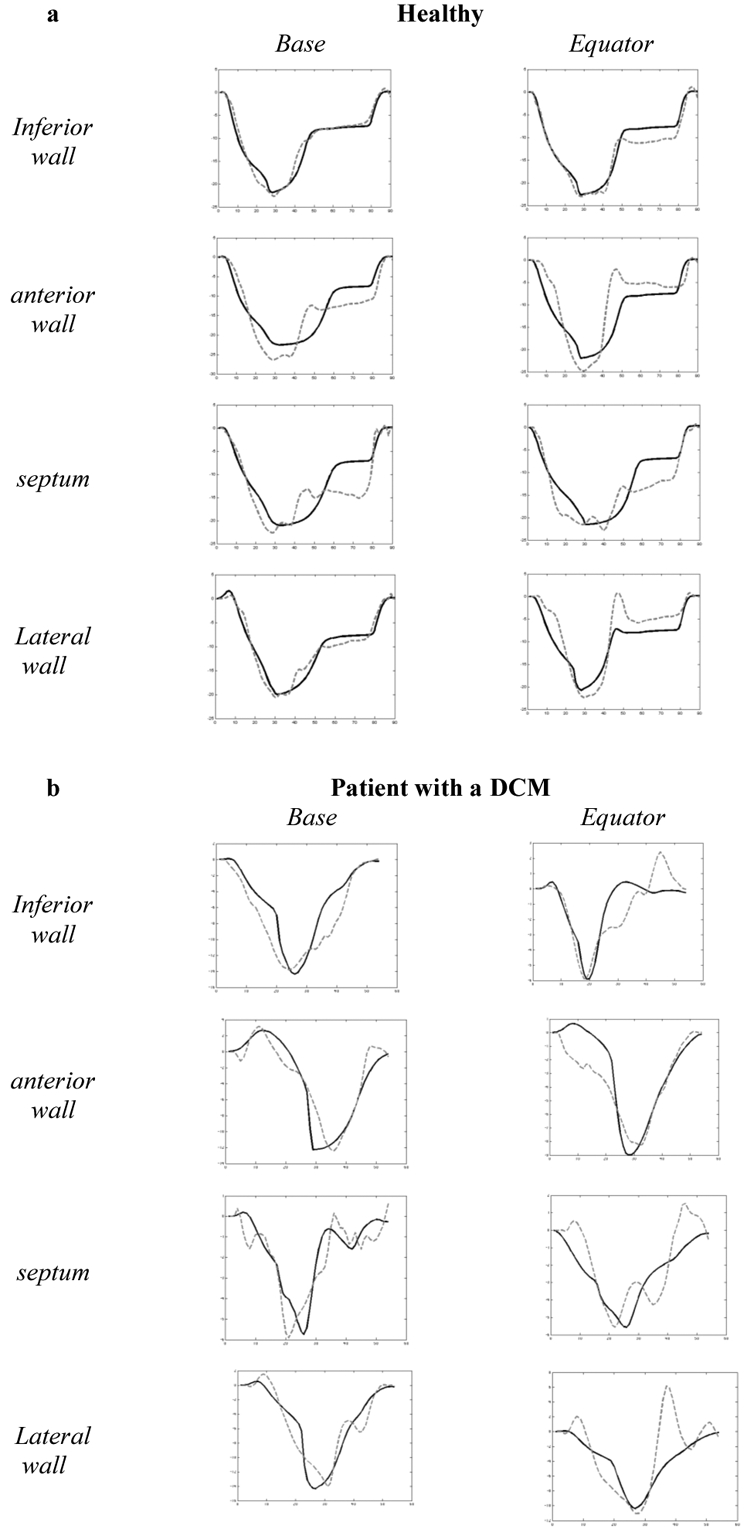
Comparison between simulated and experimental strain signals for a healthy subject (a) and a DCM patient (b) during one cardiac cycle. The black curve is the simulation and the dotted curve is the experimental data.

Comparison between simulated and experimental strain signals for a healthy subject (a) and a DCM patient (b) during one cardiac cycle. The black curve is the simulation and the dotted curve is the experimental data.