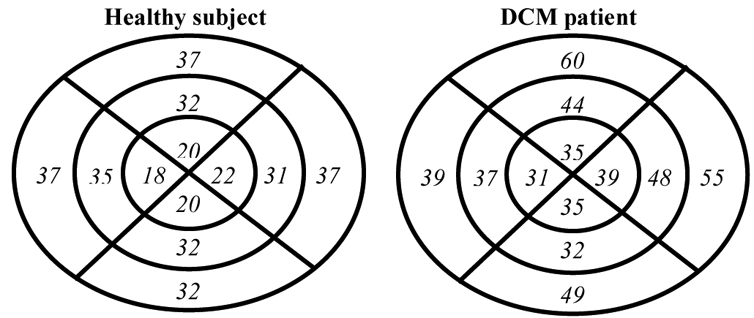
Fig. 5.

Bull’s eye representation of the identified TMP expressed as a percentage of the RR-interval for the 2 patients. For each Bull’s eye diagram, the left, top, right and down parts represent the septal, anterior free wall and posterior regions, respectively. The outer, mid- and inner rings represent the base, the equator and the apex of the LV.
