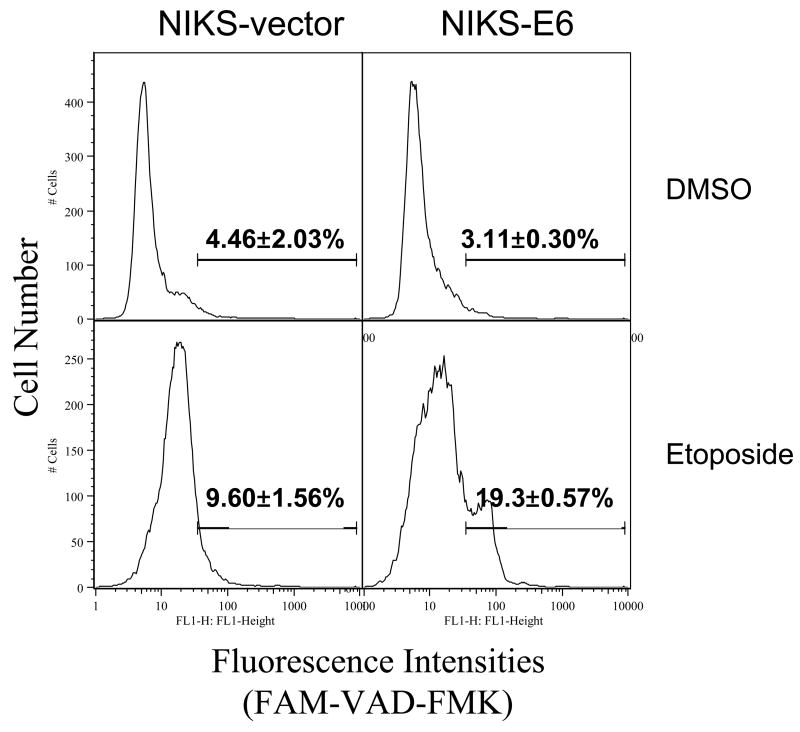
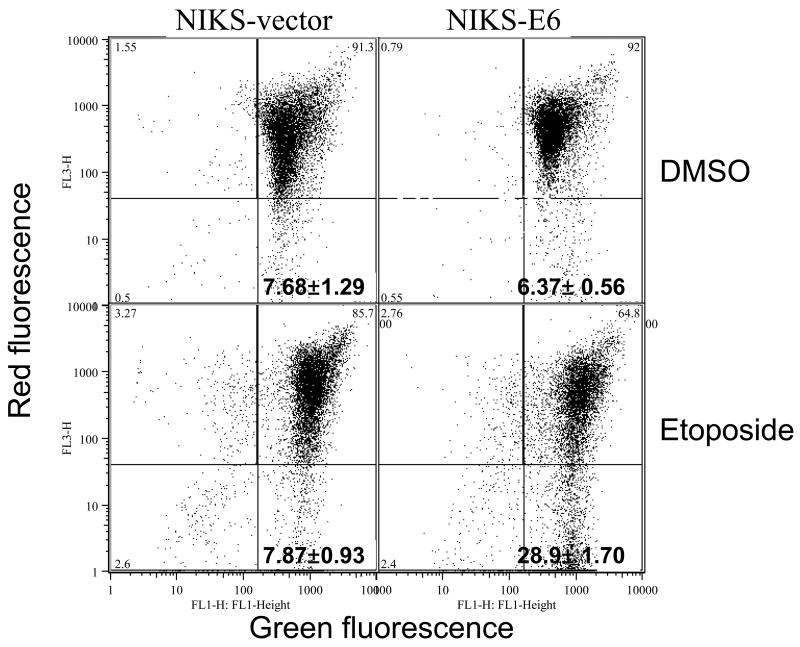
Figure 2.
Activation of caspase and loss of mtMP are seen in E6 expressing cells undergoing apoptosis. E6 or vector control NIKS cells were treated with etoposide (50 μM) or DMSO for 48 hours. A, Cells were then collected and labeled with FAM-VAD-FMK for one hour. A representative experiment (of 2) is shown. Numbers in histograms correspond to percentage of caspase positive cells. B, Cells were labeled with JC-1 and analyzed on a flow cytometer. Dot plots are red fluorescence versus green fluorescence. A representative experiment (of 2) is shown.


