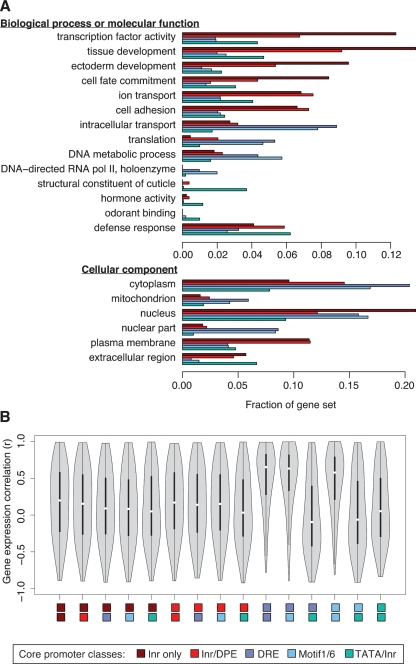
Figure 3.
Associations between core promoter types and gene functions. (A) Bars show the fraction of genes in each core promoter category that are annotated with indicated GO terms. All GO terms shown are significantly associated with a core promoter category at Bonferroni-adjusted P < 0.01 (see also Supplemental Table S3). (B) Violin plots (boxplots with added kernel density curves) show distributions of Pearson correlation coefficients for expression correlations between randomly selected gene pairs taken from pairs of core promoter categories indicated by colored rectangles below the plots. High correlations are frequent between genes with DRE core promoters and genes with Motif 1/6 core promoters, as well as among genes within each of those categories. Each distribution is based on a sample of 1000 randomly selected gene pairs. Genes were not compared against themselves.

