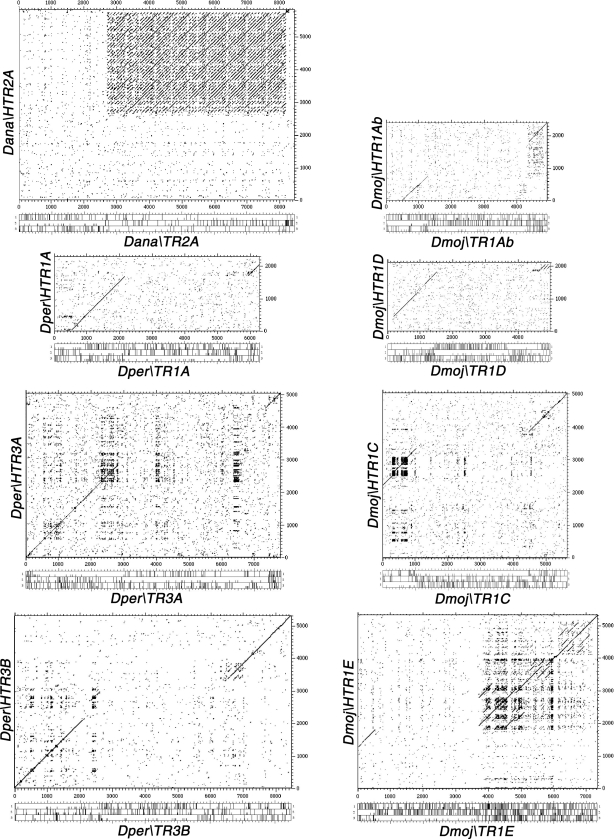
Figure 3.
Dot-matrix analysis of TRs with HTRs. Dot-matrix comparisons of the nucleotide sequence of Dana\TR2A: Dana\HTR2A, Dper\TR1A: Dper\HTR1A, Dper\TR3A: Dper\HTR3A, Dper\TR3B: Dper\HTR3B, Dmoj\TR1Ab: Dmoj\HTR1Ab, Dmoj\TR1D: Dmoj\HTR1D, Dmoj\TR1C: Dmoj\HTR1C, Dmoj\TR1E: Dmoj\HTR1E. The three-frame ORF maps are indicated.

