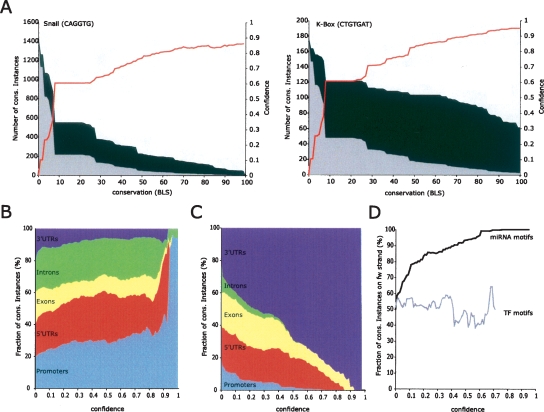
Figure 2.
High-confidence recovery of individual motif instances. (A) Mapping BLS scores to confidence values. Recovery of conserved motif instances the transcriptional repressor Snail (CAGGTG) in promoter regions (2-kb regions upstream of transcription start sites), and the K-box miRNA (CTGTGAT) in 3′ UTRs, at different BLS cutoffs (X-axis). Instances of shuffled control motifs (gray area) decrease much more rapidly than instances of real motifs (height of black curve), leading to a large fraction of motif instances conserved above background (black area). The motif-confidence score (red line) is calculated as the fraction of conserved instances above background. Random motifs are selected to have equal frequency as real motifs at BLS = 0. (B,C) Increasing confidence values select functional motif instances. With increasing confidence cutoffs (X-axis), transcription factor (TF) motif instances fall increasingly in promoter regions (light blue), 5′ UTRs (red), and introns (green), at the exclusion of 3′ UTRs (dark blue) and coding regions (yellow). In contrast, miRNA motif instances fall increasingly into 3′ UTRs to the exclusion of promoters and other regions. Relative size of regions is normalized at BLS = 0. (D) miRNA motif instances at increasing confidence cutoffs are increasingly on the transcribed strand of 3′ UTRs (black curve), while no such trend is seen for TF motifs (gray). Curves are truncated when <10 instances reach the respective confidence.

