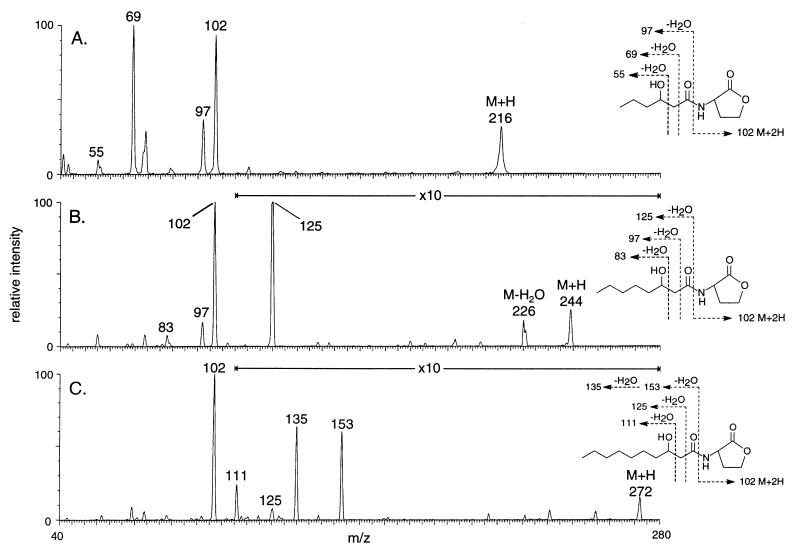
Figure 3.
Tandem MS analysis of active compounds from an extract of a culture of P. fluorescens 2-79. Samples recovered from a preparative TLC plate were analyzed by MS/CID/MS. The spectra are from samples corresponding to the three spots labeled A, B, and C in lane 3 of Fig. 1B.

