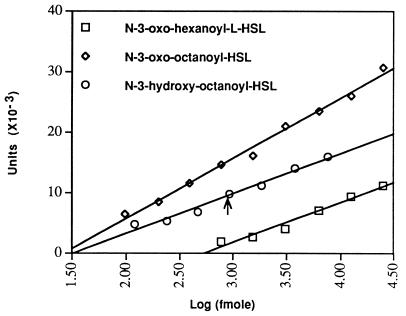
Figure 4.
Quantitation of acyl-HSLs. Samples of a series of 2-fold dilutions of the indicated acyl-HSL, along with a sample of an extract from a culture of P. fluorescens 2-79 were chromatographed on a single plate. Following detection, the blue spots were scanned by densitometry and the values for each of the standards, expressed in arbitrary units, were plotted against the amount of the acyl-HSL in each spot. The arrow marks the location to which the densitometric value for the corresponding spot from the P. fluorescens extract intersects with the standard curve derived for authentic N-(3-hydroxyoctanoyl)-l-HSL.

