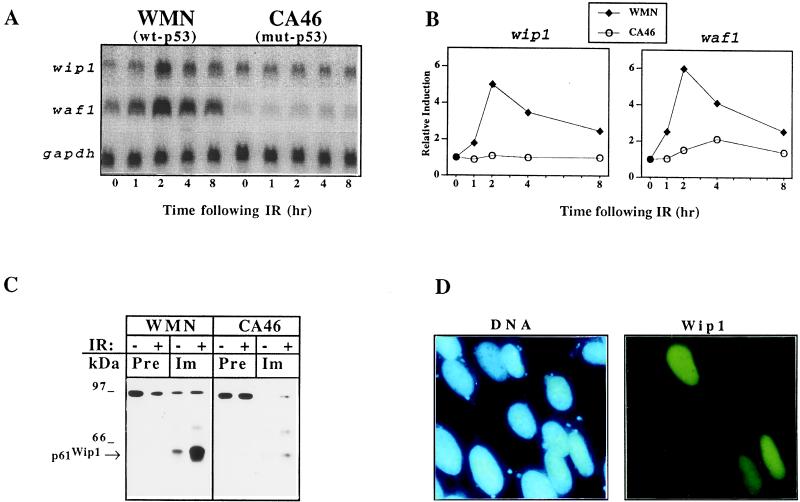
Figure 3.
Analysis of wip1 expression following IR. (A) wip1 mRNA levels increase after IR in WMN cells and reaches its peak of expression at 2 hr with a time course of induction very similar to waf1, previously shown to be directly induced by wt-p53 (8). No induction was detected in CA46 either for wip1 or for waf1, consistent with the presence of mut-p53 in this cell line. (B) Quantitation of the Northern blot shown in A by using a PhosphorImager model 425 (Molecular Dynamics). (C) Western blot of Wip1 immunoprecipitated from the nuclear fraction of WMN and CA46 cells before and 4 hr after exposure to 6.3 Gy (− or + IR). Detectable amounts of Wip1 were present only in the nuclear fraction of WMN (immunoprecipitation/Western blot of cytosolic fraction not shown), and its levels increased following IR. Immunoprecipitation was performed using either preimmune sera or antisera raised against GST–Wip1. (D) DNA and Wip1 staining of Saos-2 cells transiently transfected with a cDNA encoding for Wip1-FLAG. The fluorescein staining, which is specific for the transfected cells, can be superimposed onto the 4′-6 diamidino-2-phenylindole staining of DNA of the corresponding cells, thus confirming the nuclear localization of Wip1.

